For marketing and leadership
Replace scattered reports with one decision-ready dashboard.
A measurement and dashboard project that connects campaigns, website events, CRM stages, and operational KPIs into reporting your team can act on.
Shared KPI definitions
Campaign-to-pipeline visibility
Action-focused reporting
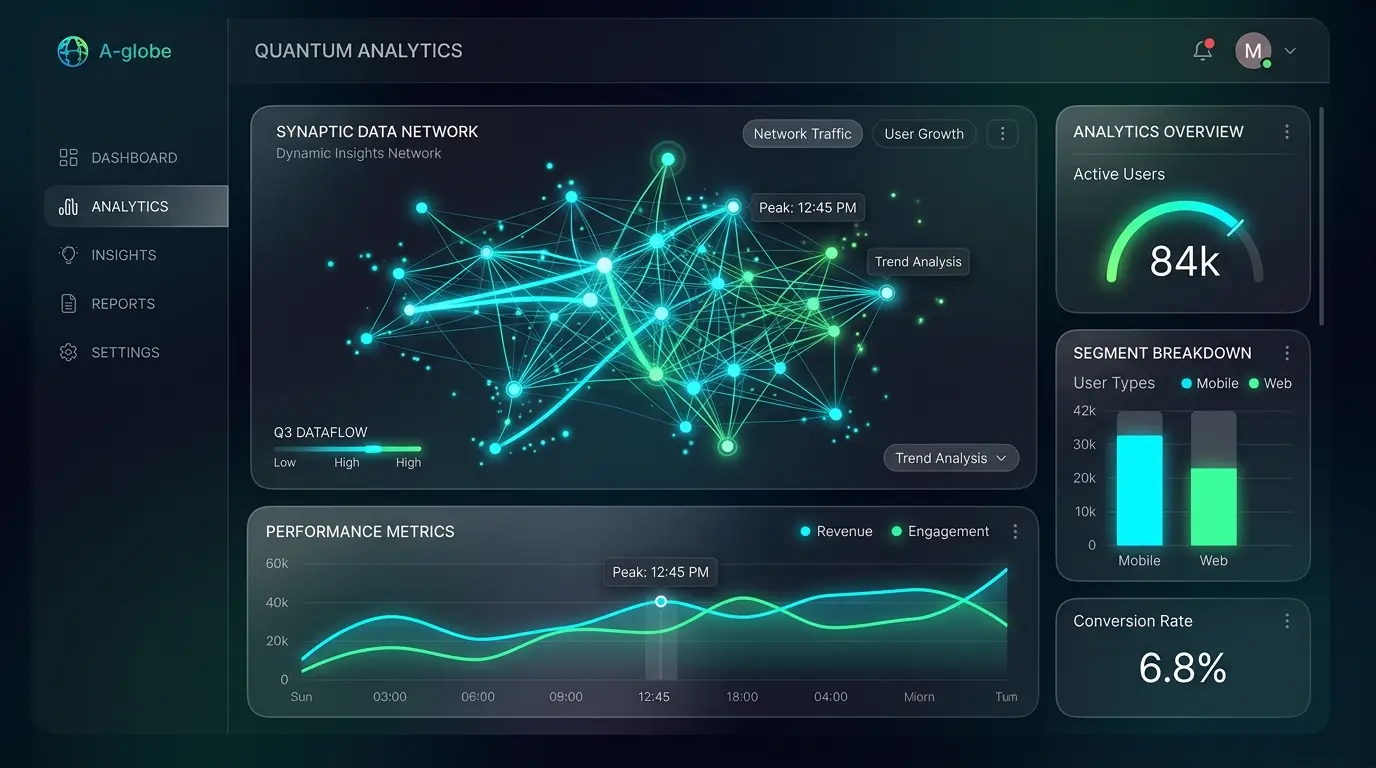
Cleaner tracking, agreed definitions, dashboard views, and recommendations linked to real business decisions.
Implementation plan
A scoped path from campaign click to useful project conversation.
Each campaign page is designed to help visitors understand the specific problem, see the work involved, and contact you with better context.
-
01
Define decisions and KPIs
-
02
Audit tracking and data sources
-
03
Build dashboard views
-
04
Review data quality and next actions
Trust and controls
Governance is part of the build, not a late add-on.
For a reporting-heavy team, we clarified definitions, connected source data, and created dashboards for campaign and pipeline review.
Controls included
- Metric definitions documented
- Source-of-truth decisions
- Access-aware dashboards
Typical integrations
GA4
Looker Studio
BigQuery
HubSpot
Salesforce
Google Sheets
Ready to move?
Start with a focused fit check before committing to a build.
Send the short enquiry and we will reply with the most sensible next step, expected inputs, and likely scope path.